Analysis
Free Energy Surfaces (FES)
Biomolecular processes, such as folding or aggregation, can be described in terms of the molecule's free energy:
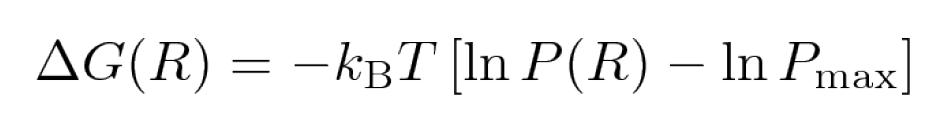
where kB is the Boltzmann constant, P is the probability distribution of the molecular system along some
coordinate R, and Pmax denotes its maximum, which is substracted to ensure that δG = 0 for the lowest free
energy minimum. Popular choices for R (so-called order parameters) are the RMSD, Rgyr, number of hydrogen bonds or
native contacts, or principal components.
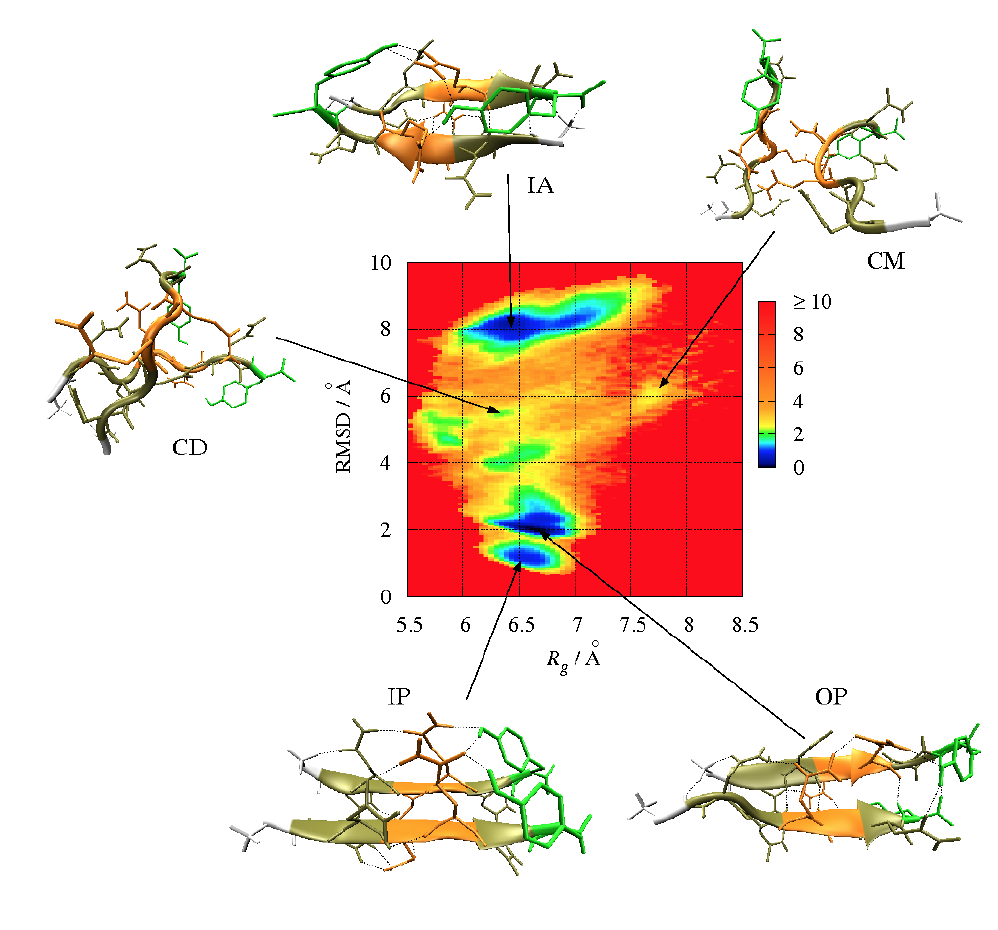
The free energy is typically plotted along two such order parameters, giving rise to a (reduced) free energy surface (FES).
Example: FES (in kcal/mol) for the aggregation of the GNNQQNY peptide forming a dimer in terms of Rgyr and the RMSD from a perfect parallel β-sheet
Generating of FESs
For generating FESs, we use the Python script generateFES.py. To create a FESF along Rgyr and the RMSD, the script is invoked as
python generateFES.py -f rgyr_rmsd.dat -o rgyr_rmsd.png -t 298 -bx 100 -by 100 -lx "Rgyr [nm]" -ly "RMSD [nm]"
- -f rgyr_rmsd.dat rows represent the time-ordered conformations, the two columns correspond to the values of two order parameters, R1 and R2,
for each of the conformations, e.g.
- -o rgyr_rmsd.png output image
- -bx 100 -by 100 number of bins for the two order parameters
- -t 298 temperature in Kelvin for which the FES shall be produced
- -lx "Rgyr [nm]" -ly "RMSD [nm]" labels for the x and y axis
FES_rygr_rmsd.dat that contains the free energies for different values of Rgyr and RMSD,
and (2) rgyr_rmsd.png, a plot of the FES that can viewed with okular:
okular FES.png
Instructions:
- Copy the
xvg filesfor Rgyr and RMSD into the working directory - Merge the Rgyr and RMSD data into one file using following commands:
awk ' {if ( $1 !~ /[#@]/) print $2 } ' gyrate.xvg > gyrate.datawk ' {if ( $1 !~ /[#@]/) print $2 } ' rmsd.xvg > rmsd.dat
or, if the values already are in one file (e.g., Ramachandran angles, PCA data), you only need to delete the header:paste gyrate.dat rmsd.dat > rgyr_rmsd.datawk ' {if ( $1 !~ /[#@]/) print $1, $2 } ' rama_protein.xvg > rama.dat - Calculate and plot the free energy using our Python script:
or for the Ramachandran plot:python generateFES.py -f rgyr_rmsd.dat -o rgyr_rmsd.png -t 298 -bx 100 -by 100 -lx "Rgyr [nm]" -ly "RMSD [nm]"python generateFES.py -f rama.dat -o rama.png -t 298 -bx 100 -by 100 -lx "Phi [deg]" -ly "Psi [deg]" - To find the frames corresponding to an energy minimum do:
For the Ramachandran plot, it is more tricky. As the dihedral angles of all residues are contained inawk ' {if ( ($1 > 0.77 ) && ($1 < 0.78 ) && ($2 > 0.75) && ($2 < 0.76)) print "Frame: ", NR-1,$1,$2}' rgyr_rmsd.dat > energy_min1_Rgyr_RMSD.datrama.dat(here yielding NΦ/Ψ = number of residues (18) - 1 = 17 entries), we have to divide the line numbers by NΦ/Ψ. To obtain the right frame, we have to add 0.49 and then round using "%.0f".:awk ' {if ( ($1 > -150 ) && ($1 < -140 ) && ($2 > 140) && ($2 < 150)) printf "%-10s\t %.0f\t %.3f\t %.3f\n", "Frame: ", (((NR-1)/17)+0.49), $1, $2}' rama.dat > energy_min1_rama.dat - Extract the frame from the trajectory for showing an example minimimum structure:
or for the Ramachandran plot:gmx trjconv -f md_protein.xtc -s md_protein.tpr -o md_protein_EM1_Rgyr-RMSD_fr1485.pdb -dump 7425
The flaggmx trjconv -f md_protein.xtc -s md_protein.tpr -o md_protein_rama_EM1_fr4.pdb -dump 20-dumprefers to a time, and not a frame.
Thus, the time corresponding to the frame identified for a energy minimum has to be calculated. Let's assume we used a time step of 5 ps between the snapshots saved in the trajectory and that we identified frame 1485 (or frame 4 for the Ramachandran plot) representing the first energy minimum. We have thus obtained the corresponding time by multiplying the frame number with the time step (1485 * 5 ps = 7425 ps or 4 * 5 = 20 ps).![Free energy surface of [KIGAKI]3 with free energy minimum](media/FESs.png)
Select "System" for the output (as only the protein is contained in the system).
- Create pictures of the conformations belonging to the energy minima (using
VMD).