Analysis
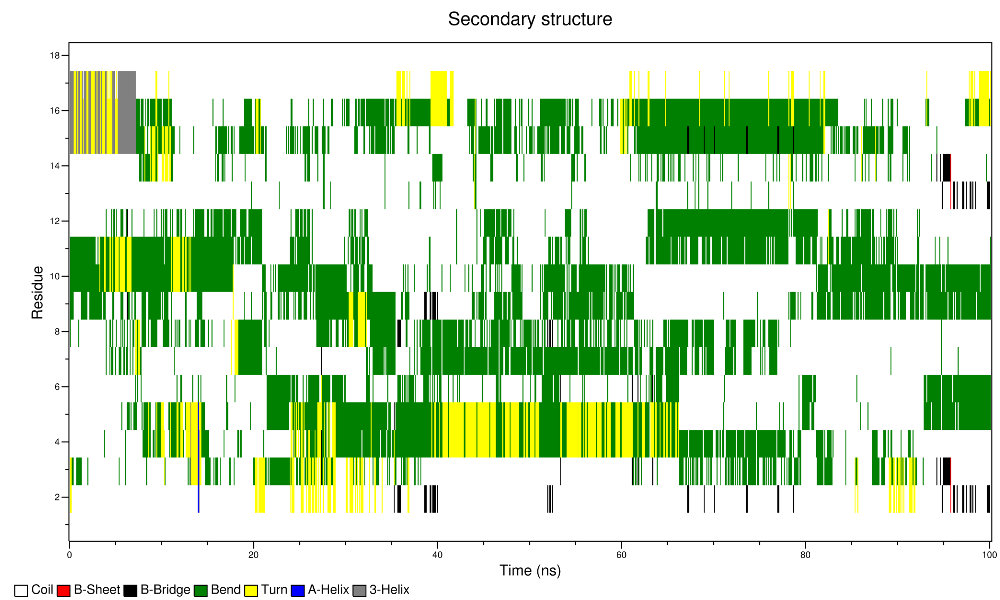
Secondary structure
DSSP
You can generate a plot of the secondary structure per residue versus time using Gromacs. You first need to make sure that the program DSSP is either installed on your computer (just try to run the commanddssp and check if it works)
or download it from the DSSP website.
Now you need to export a variable that contains the full path to your DSSP executable:
export DSSP=/full/path/to/dssp for bash shell
sentenv DSSP /full/path/to/dssp for csh shell
which dssp.
This step is only necessary to enable Gromacs to find the dssp executable.
Now execute these three commands in order:
gmx do_dssp -f md_protein.xtc -s md_protein.tpr -o ss.xpm
gmx xpm2ps -f ss.xpm -o ss.eps -bx 1 -by 30
ps2pdf -sPAPERSIZE=ledger ss.eps ss.pdf
To reduce the time needed for the calculation of the secondary structure and also to improve the appearence of the final plot, you might want to pass the
-tu ns (setting the time unit to ns instead of ps) together with
-dt 1 so that the secondary structure will be analyzed only every 1 ns (considering that on shorter
times not much secondary structure changes occur).
If the
ps2pdf tool should not be installed, google to find a way to directly open the
ss.eps file.
Otherwise, open the obtained file ss.pdf with a pdf reader of your choice.
You should obtain a plot that shows how the secondary structure of [KIGAKI]3 evolving with time,
similar to the figure above.
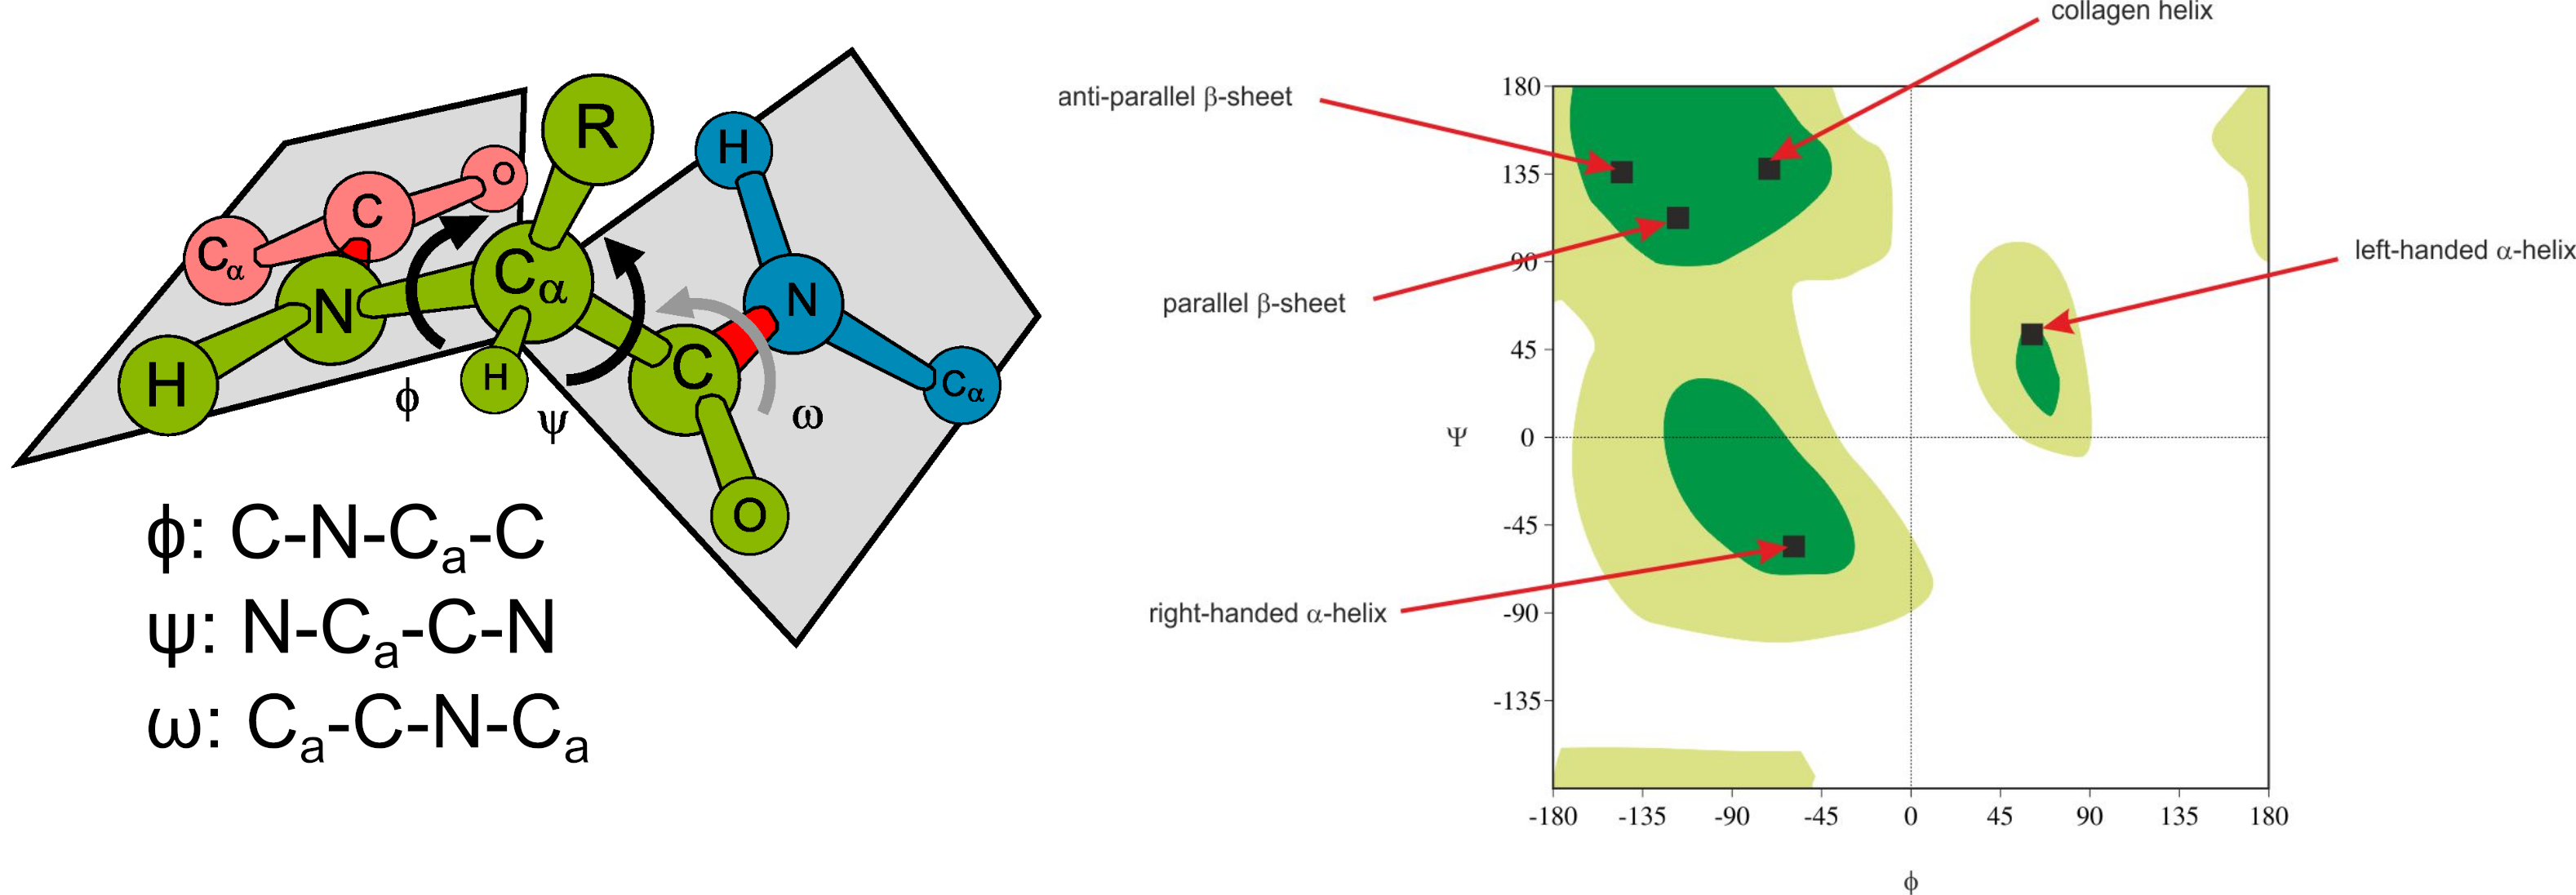
Ramachandran Plot
A Ramachandran plot is a plot of the torsional angles - Phi (Φ) and Psi (Ψ) - of the residues contained in a protein. In sequence order, Φ is the N(i-1),C(i),Ca(i),N(i) torsion angle and Ψ is the C(i),Ca(i),N(i),C(i+1) torsion angle. The plot was developed in 1963 by G. N. Ramachandran et. al., plotting the Φ values on the x-axis and the Ψ values on the y-axis. The torsional angles of each residue in a protein define its conformation. Many of the angle combinations, and therefore the conformations of residues, are not possible because of steric hindrance.
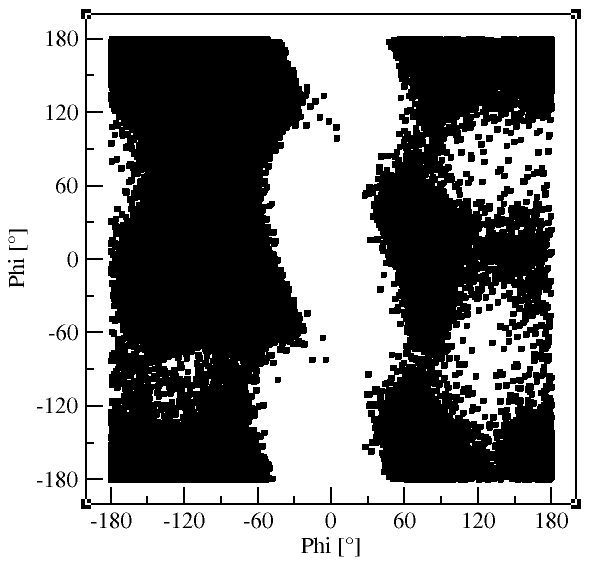
gmx rama generates a Ramachandran plot showing Φ and Ψ for all residues and
snapshots. Select Group 1 for "Protein".
gmx rama -f md_protein.xtc -s md_protein.tpr -o rama_protein.xvg